The Atlas of Economic Complexity represents one of the most sophisticated attempts to map and understand the intricate web of global economic relationships. Developed by Harvard’s Growth Lab, this remarkable platform transforms decades of trade data into compelling visual narratives that reveal how countries develop their productive capabilities over time.
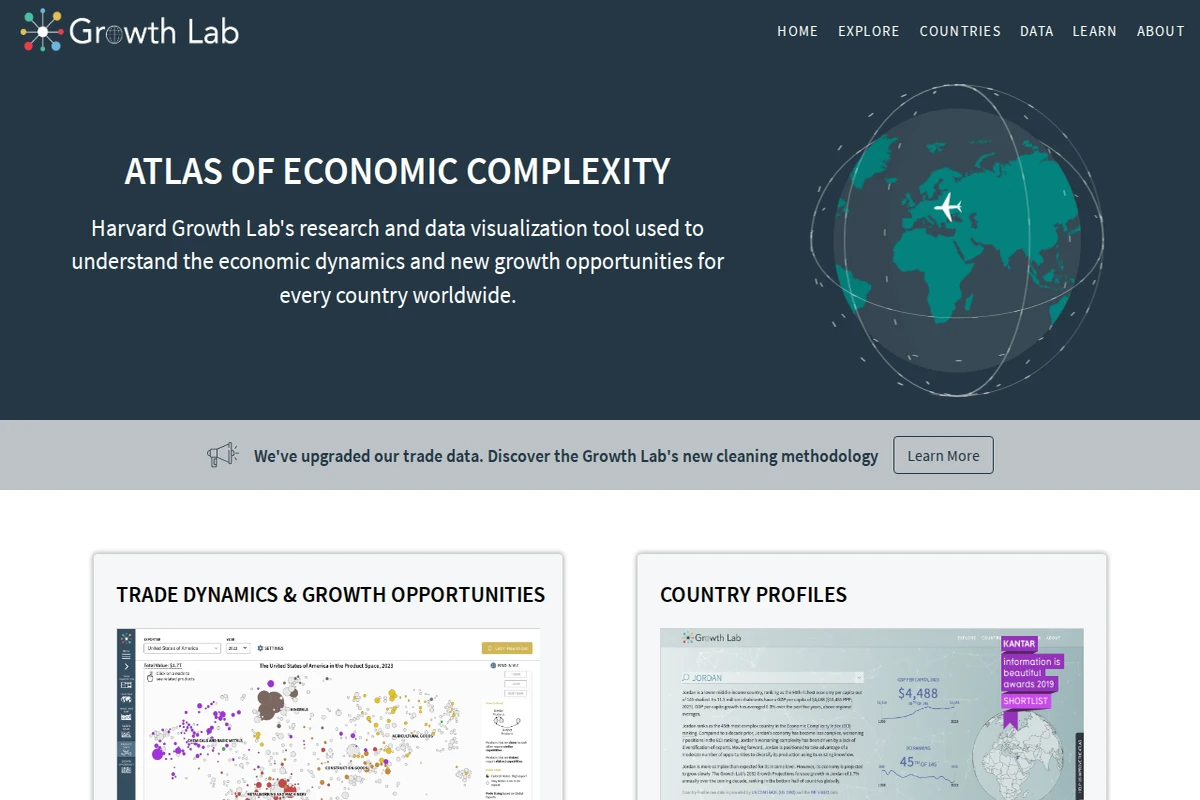
At its core, the Atlas employs the concept of economic complexity — the idea that a country’s economic sophistication can be measured by the diversity and uniqueness of its exports. Through stunning interactive visualizations, users can explore trade dynamics, country profiles, and growth projections that span more than half a century. The platform’s product space visualizations are particularly striking, showing how different products cluster together based on the capabilities required to produce them.
What sets this tool apart is its practical application in real-world policy making. The Atlas has been used by governments, international organizations, and researchers in over 228 countries to identify strategic opportunities for economic diversification and growth. The platform’s annual complexity rankings and growth projections have become influential references in development economics, helping countries understand not just where they are, but where they might go next.
Beyond its analytical power, the Atlas serves as a masterclass in data visualization design. The interface seamlessly blends academic rigor with accessible presentation, making complex economic theories understandable to both specialists and curious citizens. It’s a testament to how thoughtful design can democratize sophisticated research and make global economic patterns visible to all.