Nicholas Rougeux has carved out a fascinating niche at the intersection of data visualization and historical preservation. This Midwest-based artist specializes in creating meticulous digital recreations of vintage scientific illustrations, organizational charts, and educational materials that might otherwise be forgotten to time.
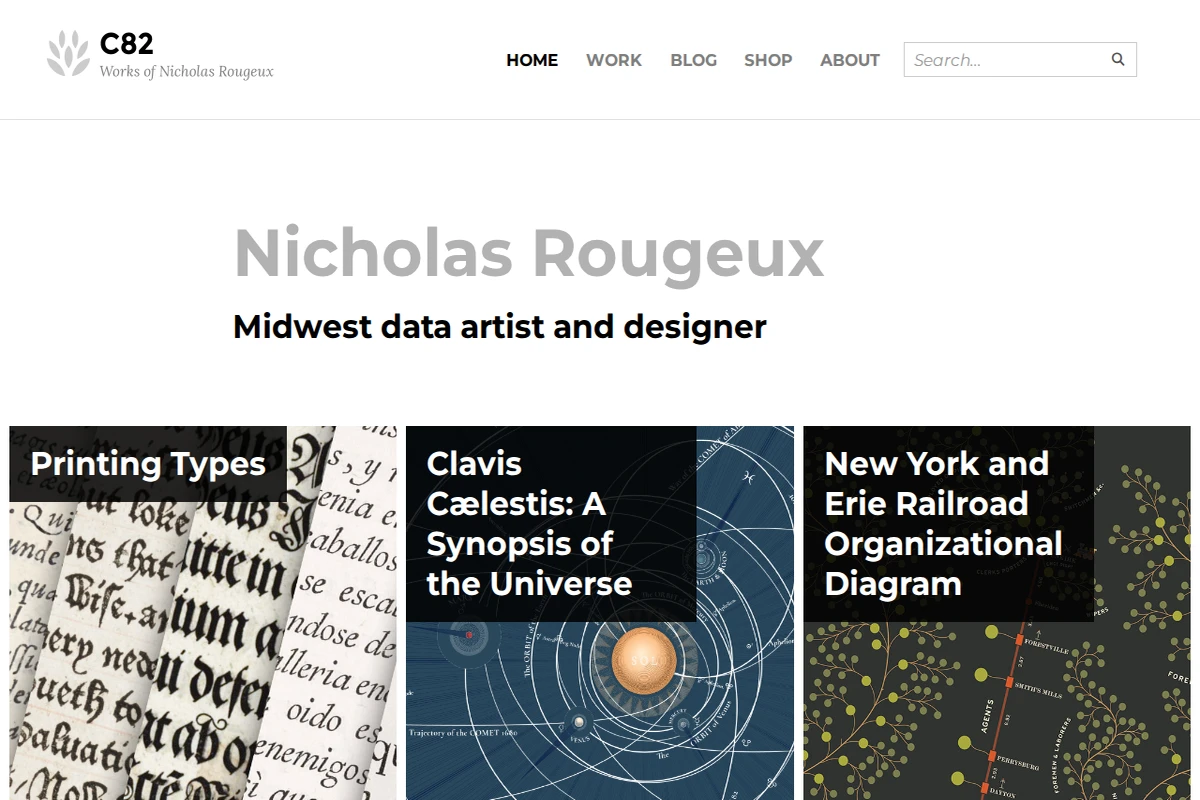
His portfolio showcases an impressive range of projects, from the intricate astronomical diagrams of Thomas Wright’s 1742 Clavis Cælestis to the elaborate typography specimens in Daniel Updike’s printing guide. Each project represents months of painstaking research and reconstruction work. Rougeux doesn’t simply scan or photograph these historical documents—he rebuilds them from scratch, often spending considerable time hunting down source materials and understanding their original context.
What sets this work apart is the depth of historical investigation that accompanies each piece. The blog posts detailing his process read like detective stories, following clues through centuries-old publications and institutional archives. His recreation of the 1855 New York and Erie Railroad organizational diagram, for instance, led him down rabbit holes exploring American business history and early corporate visualization techniques.
The site serves as both portfolio and educational resource, making these historical treasures accessible to contemporary audiences while preserving them for the future. It’s a masterclass in how digital tools can breathe new life into archival materials.
🔗 c82.net