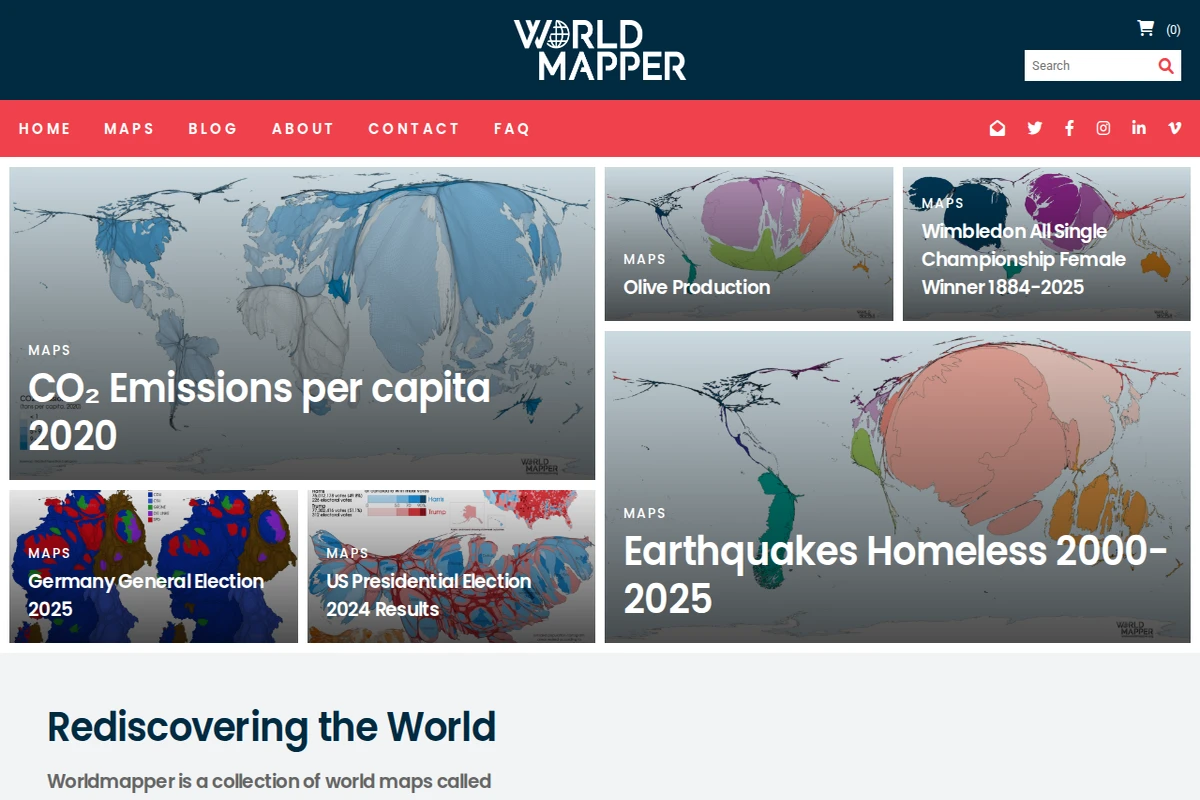
Worldmapper presents a fascinating alternative to conventional cartography by creating cartograms where countries and territories are resized according to specific data points rather than geographical area. This ingenious approach reveals patterns and relationships in global data that traditional maps often obscure.
The platform offers an extensive collection of maps covering diverse topics from environmental data like CO₂ emissions per capita to cultural phenomena such as Wimbledon championship winners by country. Each cartogram transforms our familiar world map into something both alien and illuminating — countries might appear as tiny slivers or massive blobs depending on their relationship to the measured variable.
What makes Worldmapper particularly valuable is how it challenges our geographical assumptions and reveals the true distribution of global phenomena. A map showing internet usage might make Silicon Valley appear enormous while entire continents shrink, offering immediate visual insight into digital divides that raw statistics alone cannot convey.
The continuously updated collection serves researchers, educators, and curious minds seeking to understand our world through data-driven geography, making complex global patterns accessible through intuitive visual storytelling.