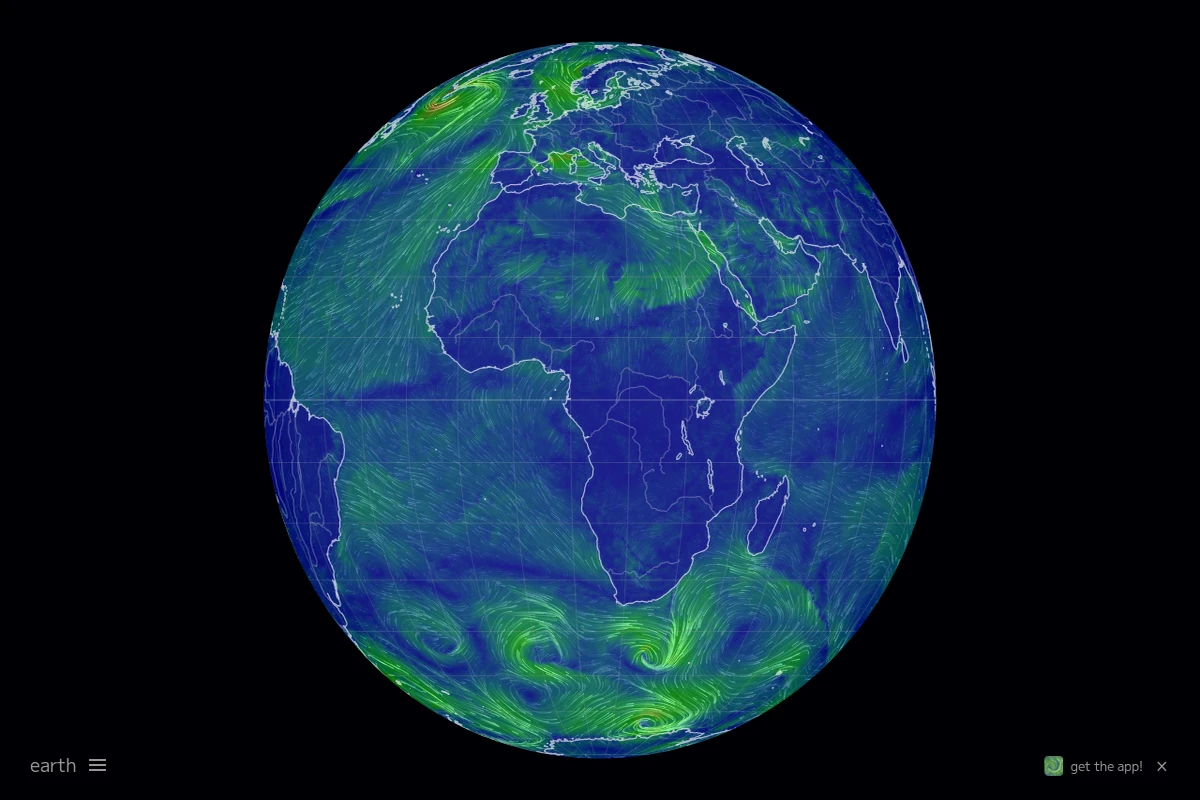
Interactive world map displaying colorful submarine cable routes connecting continents across ocean floors with search interface and cable listings.

submarinecablemap.com

Submarine Cable Map - Global Underwater Internet Infrastructure

The internet may feel ethereal, but its physical foundation runs along the ocean floor in the form of hundreds of submarine cables. TeleGeography’s Submarine Cable Map reveals the hidden infrastructure that makes global communication possible, showing how fiber-optic cables snake across ocean basins to connect continents. This meticulously maintained resource tracks active, planned, and retired submarine cables worldwide. Each colorful line represents a crucial piece of internet infrastructure, from major trans-Atlantic routes like Dunant and Grace Hopper to regional systems connecting island nations. The interactive interface allows users to search by cable name, landing point, or country, revealing technical details about capacity, length, and operational status. ...

March 24, 2026 · Cogimator Team
Screenshot of ORBIS interface showing an interactive map of the Roman Empire with transport routes and travel time calculations between cities.

orbis.stanford.edu

ORBIS: Stanford's Roman World Transport Model

ORBIS represents a groundbreaking achievement in digital historical scholarship, transforming our understanding of connectivity in the ancient world. Developed by Stanford University, this sophisticated geospatial network model reconstructs the true shape of the Roman Empire not as it appears on conventional maps, but as it was experienced by people living within its vast boundaries. The project’s fundamental insight is revolutionary: in the premodern world, cost rather than distance determined connectivity. By simulating movement along the extensive Roman road network, major navigable rivers, and hundreds of Mediterranean, Black Sea, and coastal Atlantic routes, ORBIS reveals how geography, technology, and seasonal variations shaped the flow of people, goods, and information across three continents. The model accounts for different modes of transport from oxcarts to horse relays, incorporating realistic travel speeds and costs. ...

March 23, 2026 · Cogimator Team
An interactive map visualization showing Reddit communities as colored territories arranged geographically based on user overlap patterns.

anvaka.github.io/map-of-reddit

Interactive Map of Reddit Communities

This remarkable data visualization transforms Reddit’s vast ecosystem of communities into an interactive geographical map, where each subreddit becomes a territory with borders, neighbors, and relative sizes. Created by Andrei Kashcha, this project maps over 8,000 subreddits based on user overlap patterns, creating a landscape where similar communities naturally cluster together. The visualization reveals fascinating insights about Reddit’s social geography. Gaming communities form their own continent, while political subreddits create distinct regions that rarely overlap. Science and technology forums cluster in their own neighborhoods, and niche hobby communities form small islands connected by bridges of shared interests. The size of each territory reflects the community’s activity level, while the proximity indicates how much users move between related subreddits. ...

March 22, 2026 · Cogimator Team
Preview of Zoom Earth – satellite data of cloud coverage

zoom.earth

Zoom Earth – watch near real-time satellite imagery of Earth

Zoom Earth is an interactive satellite map that displays near real-time weather data from NASA, NOAA, and Blue Marble. View global cloud formations, track hurricanes and typhoons, follow wildfires, and explore ocean temperature anomalies – all in one interface. With frequent updates and high visual fidelity, it’s a must-have for weather enthusiasts, travelers, educators, and curious explorers of our living planet. 🔗 zoom.earth

July 26, 2025 · Cogimator Team